Update - 26th March 2020, 9.20 AM
Though, Nifty neither did respect the Morning star pattern nor held on to the mentioned supports, and could not surpass the same, we didn't get any long entry then....
However, below 7800, Nifty halted near the first support mentioned of 7500, and after creating a low of 7511, has so far rallied till 8300-8400
It is very crucial now, that the recovery which happens, should take place in a consolidation manner and there should not be any V shape recovery as seen earlier, as they prove to be short lived.
On the IV side, since 6th Mar, it closed in red only for the second time yesterday, and more importantly, created a bearish like pattern (Harami / Dark Cloud), and today, slipped below yesterday's low, further bearish confirmation for IV can be when IV breaks the low near 71.95, which would confirm the bearish pattern. (CMP 76.90).
All said and done, a recovery, or let me say a sustained recovery can only be possible if we consolidate near these levels with a gradual fall in India VIX... If, without breaking the supports, if VIX creates a new life above 86.64, it could mean some more volatility and pain is still left for markets on its way down...
Cheers
Hrishi
Hi All,
Hope you are safe. Please take care of you and your loved ones.... Be blessed
Now, coming to the biggest question I am asked about by many of you..
What to expect now ? ? ?
...and there are multiple answers for this...
Firstly, as posted in Bang Bang... Is the worst over?, it was expected that the lows of 8555 are likely to be broken sooner than later, however, this too happened very quickly and did not expect the same. The main reason for that rally to reverse was that Nifty did not cross the high of 10160, as mentioned
Now, one week down the line, we are at a similar juncture. Though there are small differences which made me think that we might have a bottom, at least for a while...
As we know, Nifty was slaughtered during the week and was sent all the way down to the lows near 7800. However, yet again, it managed to pull back sharply and currently trades near 8700-8800 mark. This time, the story was a bit different, as on Friday, Nifty managed to surpass the high of the Spinning top like pattern (indecision / trend change) of Thursday, and more importantly, Friday's strong rally of more than 500 points, have given a Morning Star Like pattern on daily charts, which off course is a Bullish evidence... (though a close above 8767-70 would have made it a complete Morning Star)
Also, on the RSI front, there is a Bullish Divergence, for the first time in this huge fall which started in February..

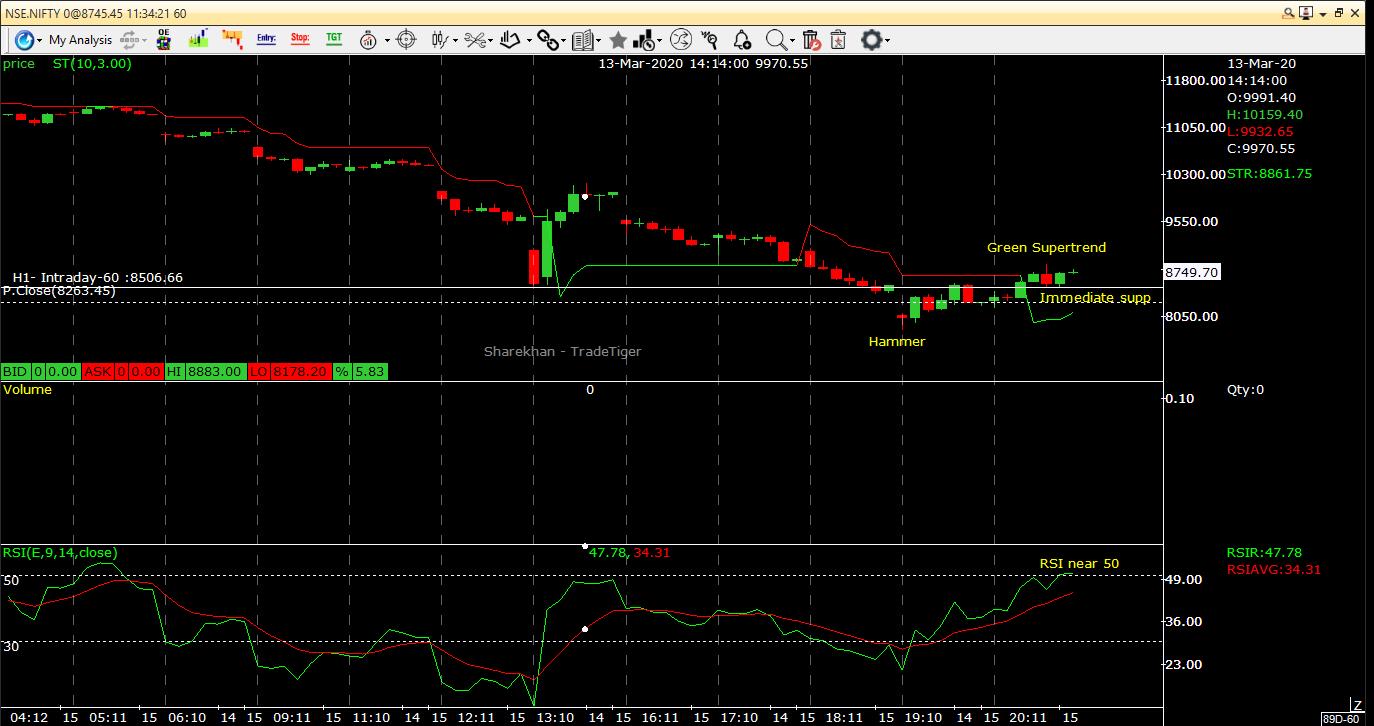
This was started by a perfect Bullish Hammer pattern on the hourly charts of Thursday (I initiated longs which was circulated on What's App broadcast), Also hourly Supertrend has turned positive, only for the second time after the strong pull back of last Friday. And also the hourly RSI is near 50 mark, below the overbought zone.

On monthly chart, the trendline earlier mentioned in Lee Bazaar, Nifty 9 hajaar post, is not valid any more, as the prices close below the 9k mark. However, an another confirmed trendline, from the lows of 4500 in Dec 2011, has supported price, at least on a closing basis. The support for the same would be near 8200

Plan of Action
To start of with, currently the SGX Nifty is trading near 8200, down by ~600 points, which means that the Morning Star pattern too is not respected.
However, if this changes till Monday, in order to keep the momentum going, the immediate support for bulls are going to be 8500-8530, below which, as per the hourly chart, it can go down till 8170-60 levels
I feel, any further upmove is only possible only above the confirmation zone mentioned in the first daily chart image above (8900 for aggressive traders and 9130-40 for conservative ones). If these levels are sustained, we can expect a pull back till 9900-10150.
On the lower side, as mentioned earlier, 8500-8200 (closing basis, trend line)-8170-8100-8000-7800 would be crucial support areas.
If the 7.8k level is broken on the lower side, 7500-7300-7000 are the ray of hope for bulls.
Even though charts are not convincing enough to call this as a full proof bottom, if prices sustain and respect the afore said levels, we can expect at least a short term bounce without breaking the recent low of 7800, either starting from Monday or may be a bit after...
Let's wait and Watch...
Cheers
Hrishi
Though, Nifty neither did respect the Morning star pattern nor held on to the mentioned supports, and could not surpass the same, we didn't get any long entry then....
However, below 7800, Nifty halted near the first support mentioned of 7500, and after creating a low of 7511, has so far rallied till 8300-8400
It is very crucial now, that the recovery which happens, should take place in a consolidation manner and there should not be any V shape recovery as seen earlier, as they prove to be short lived.
On the IV side, since 6th Mar, it closed in red only for the second time yesterday, and more importantly, created a bearish like pattern (Harami / Dark Cloud), and today, slipped below yesterday's low, further bearish confirmation for IV can be when IV breaks the low near 71.95, which would confirm the bearish pattern. (CMP 76.90).
All said and done, a recovery, or let me say a sustained recovery can only be possible if we consolidate near these levels with a gradual fall in India VIX... If, without breaking the supports, if VIX creates a new life above 86.64, it could mean some more volatility and pain is still left for markets on its way down...
Cheers
Hrishi
Hi All,
Hope you are safe. Please take care of you and your loved ones.... Be blessed
Now, coming to the biggest question I am asked about by many of you..
What to expect now ? ? ?
...and there are multiple answers for this...
Firstly, as posted in Bang Bang... Is the worst over?, it was expected that the lows of 8555 are likely to be broken sooner than later, however, this too happened very quickly and did not expect the same. The main reason for that rally to reverse was that Nifty did not cross the high of 10160, as mentioned
Now, one week down the line, we are at a similar juncture. Though there are small differences which made me think that we might have a bottom, at least for a while...
As we know, Nifty was slaughtered during the week and was sent all the way down to the lows near 7800. However, yet again, it managed to pull back sharply and currently trades near 8700-8800 mark. This time, the story was a bit different, as on Friday, Nifty managed to surpass the high of the Spinning top like pattern (indecision / trend change) of Thursday, and more importantly, Friday's strong rally of more than 500 points, have given a Morning Star Like pattern on daily charts, which off course is a Bullish evidence... (though a close above 8767-70 would have made it a complete Morning Star)
Also, on the RSI front, there is a Bullish Divergence, for the first time in this huge fall which started in February..

This was started by a perfect Bullish Hammer pattern on the hourly charts of Thursday (I initiated longs which was circulated on What's App broadcast), Also hourly Supertrend has turned positive, only for the second time after the strong pull back of last Friday. And also the hourly RSI is near 50 mark, below the overbought zone.
On monthly chart, the trendline earlier mentioned in Lee Bazaar, Nifty 9 hajaar post, is not valid any more, as the prices close below the 9k mark. However, an another confirmed trendline, from the lows of 4500 in Dec 2011, has supported price, at least on a closing basis. The support for the same would be near 8200

Plan of Action
To start of with, currently the SGX Nifty is trading near 8200, down by ~600 points, which means that the Morning Star pattern too is not respected.
However, if this changes till Monday, in order to keep the momentum going, the immediate support for bulls are going to be 8500-8530, below which, as per the hourly chart, it can go down till 8170-60 levels
I feel, any further upmove is only possible only above the confirmation zone mentioned in the first daily chart image above (8900 for aggressive traders and 9130-40 for conservative ones). If these levels are sustained, we can expect a pull back till 9900-10150.
On the lower side, as mentioned earlier, 8500-8200 (closing basis, trend line)-8170-8100-8000-7800 would be crucial support areas.
If the 7.8k level is broken on the lower side, 7500-7300-7000 are the ray of hope for bulls.
Even though charts are not convincing enough to call this as a full proof bottom, if prices sustain and respect the afore said levels, we can expect at least a short term bounce without breaking the recent low of 7800, either starting from Monday or may be a bit after...
Let's wait and Watch...
Cheers
Hrishi

No comments:
Post a Comment